Mixer
Mix the eight primitives
Move the sliders to blend the eight TPMS primitives from the paper and watch the cells change. The plot shows the measured curve of the nearest tested structure, and the list below it holds all 274 tested samples. There is also a full-page version.
Geometry definitions follow TPMeSh.Everything runs in your browser.
In short
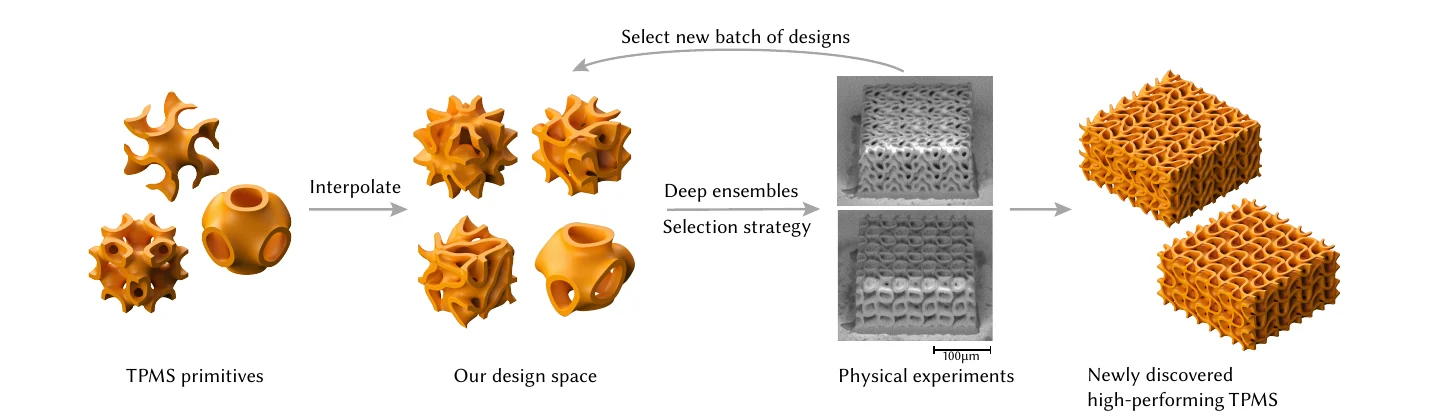
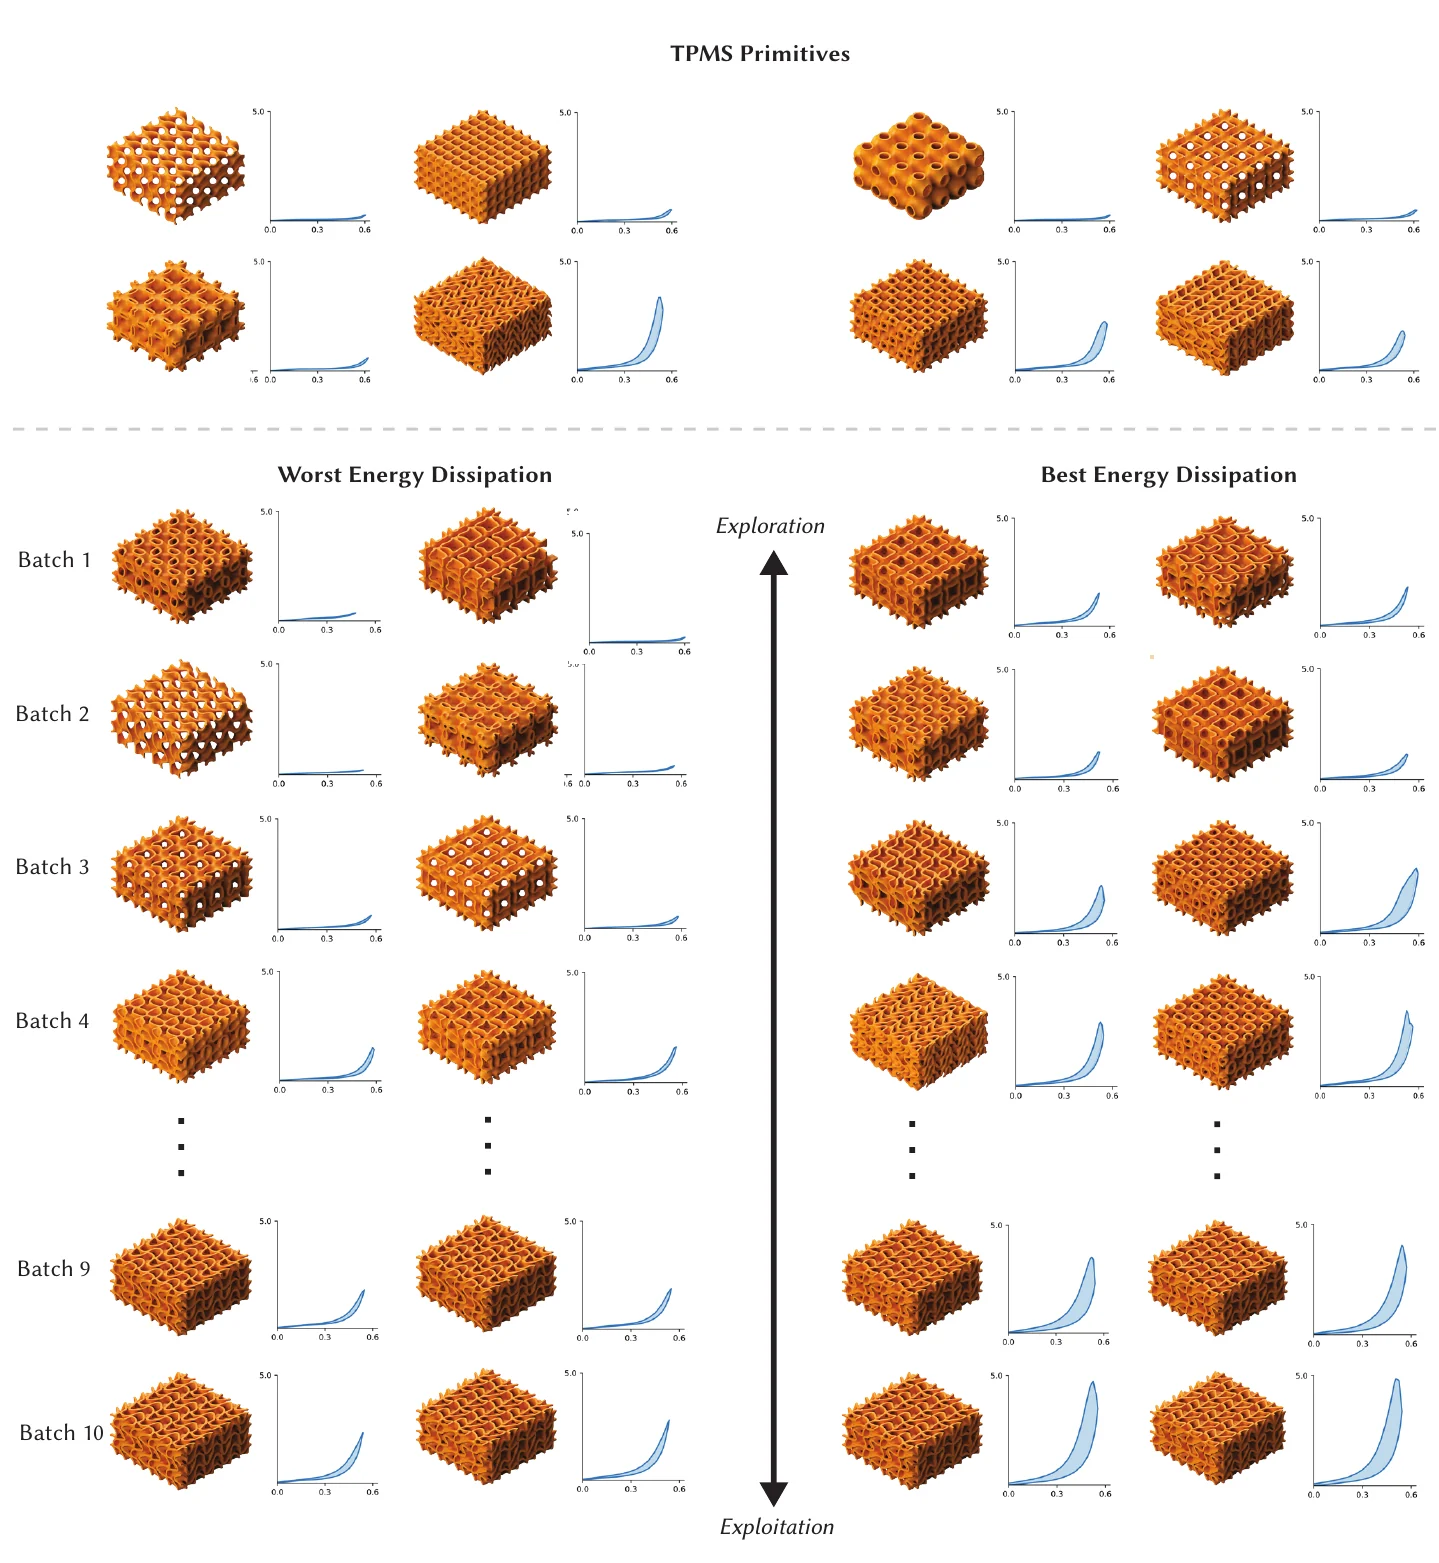
Triply periodic minimal surfaces (TPMS) are smooth surfaces that repeat in all three directions. Thickened into thin sheets they make lightweight lattices that can be compressed far and spring back. A few classic shapes, the primitives, are well studied. We blend eight of them into one continuous design space and search it for structures that dissipate as much energy as possible under compression, the quantity that matters for padding, protection and impact absorption.
Simulating these microscale, hyperelastic, self-contacting lattices accurately is too slow to drive a search, so we test real prints instead. Each structure is printed at about 170 µm across with two-photon lithography and compressed with a nanoindenter. A deep ensemble trained on the measured curves predicts the stress-strain curve of any mix and how uncertain it is, and an acquisition rule picks the next batch to print. In ten printing sessions this found structures that dissipate over twice the energy of the best primitive.
Section 3
A design space of blended surfaces
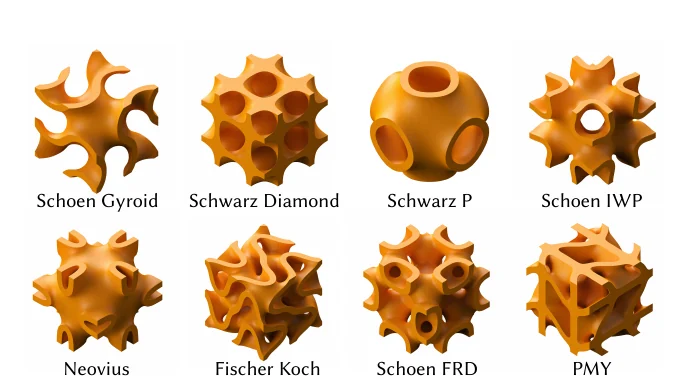
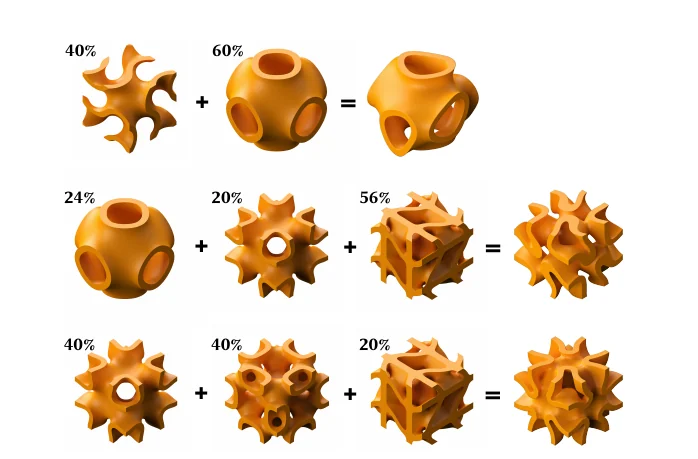
Each primitive is the zero set of a simple trigonometric function, periodic with period 2π. We use eight of them: Schoen Gyroid, Schwarz Diamond, Schwarz P, Schoen IWP, Neovius, Fischer-Koch, Schoen FRD and PMY. A design is a point on the simplex of eight weights that sum to one, and its surface is the zero set of the weighted sum
F(x, y, z) = Σi wi fi(x, y, z).
Because the weights interpolate the functions, not the shapes, the structures morph smoothly from one primitive into another, and mixes of three or four primitives give shapes that none of them has alone. The mixer at the top of this page evaluates exactly this sum.
The zero set is a surface with no thickness. To print it we keep the band where |F| is less than ½ t ‖∇F‖, which gives walls of uniform width t. All structures in the paper use the same thickness, and the printed blocks are 4 × 4 × 2 cells.
Section 4
Why we print instead of simulate
Prior work on metamaterial design trains models on simulations. For these structures that does not work well enough: the material is hyperelastic, the lattices fold onto themselves under large compression, and the printed geometry differs from the design because of the voxel size of the printer and shrinkage during development. Periodic simulations take hours per structure and still disagree with measurements; full-scale simulations with contact are impractical at the scale of a search.
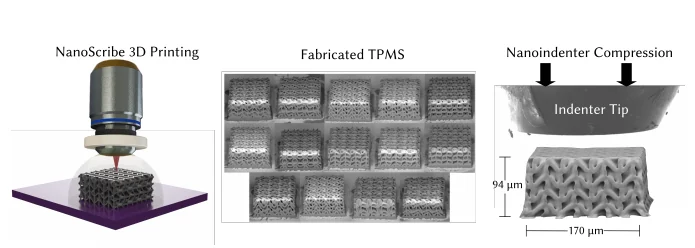
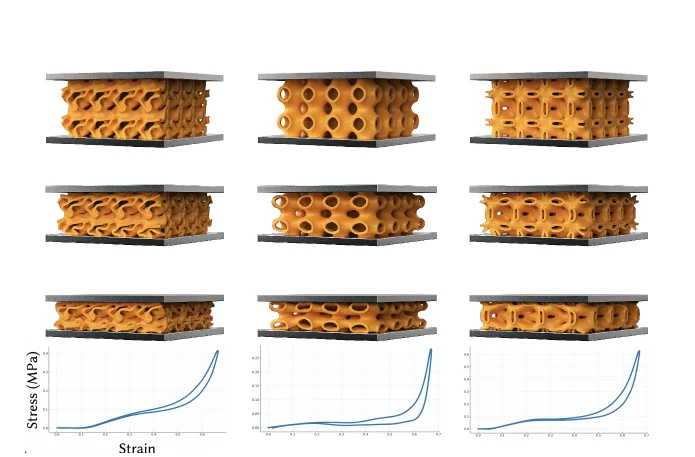
So the data in this paper comes from physical tests only. Each structure is printed from IP-PDMS resin on a Nanoscribe two-photon lithography system (1 µm slicing, 0.5 µm hatching), shrinks to roughly 170 × 170 × 94 µm during development, and is compressed with a flat-punch nanoindenter to about 55% strain and unloaded. Every structure is printed and tested twice; the two curves are averaged, smoothed, and resampled to 120 points.
Energy dissipation is the area of the loop
The objective is the area between the loading and unloading halves of the stress-strain curve, in kJ/m³. A stiff structure that springs back along the same path dissipates little; a structure whose unloading curve drops well below its loading curve dissipates a lot.
Section 5
A surrogate that knows what it does not know
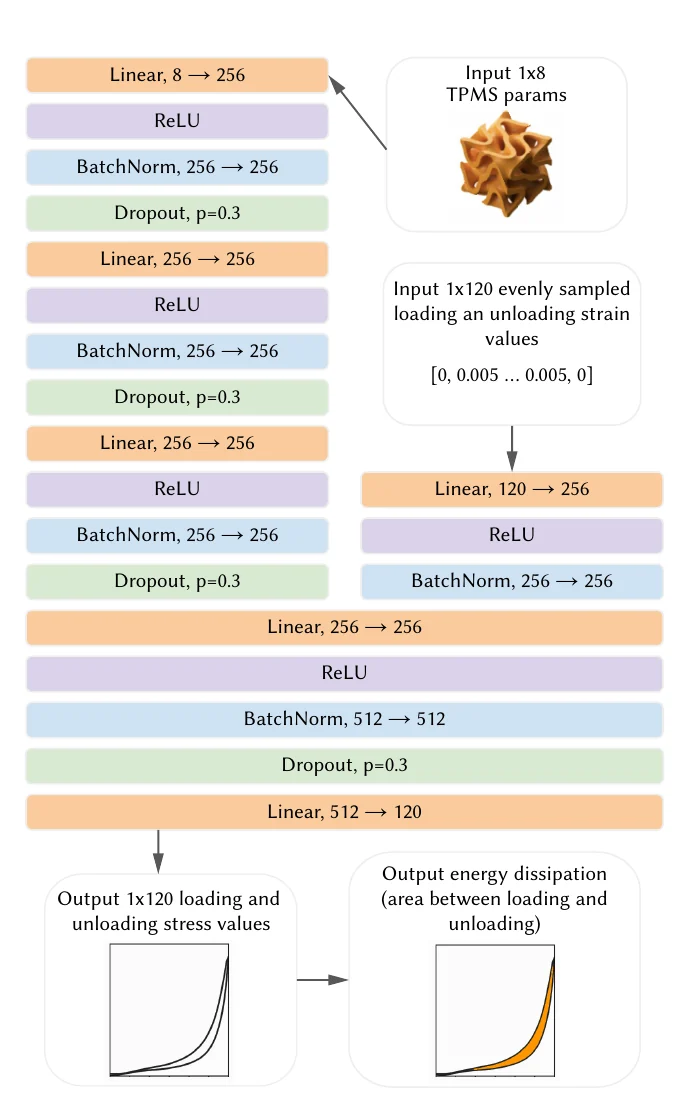
The surrogate is a deep ensemble: thirty two-headed multilayer perceptrons trained on the same measured curves from different random initializations. One head takes the eight weights, the other the strain axis, and the network outputs the 120 stress values of the curve. The spread of the thirty predictions is the uncertainty. Dropout, batch normalization and early stopping keep the small dataset from being overfitted.
From the predicted curve we get the predicted energy dissipation μ(w) and its standard deviation σ(w). Batches are chosen with an upper confidence bound,
UCB(w) = μ(w) + κ σ(w),
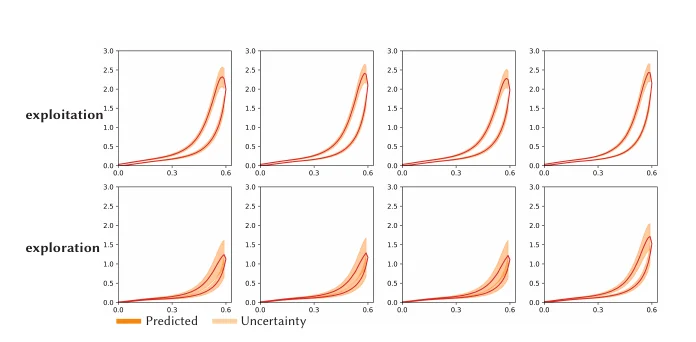
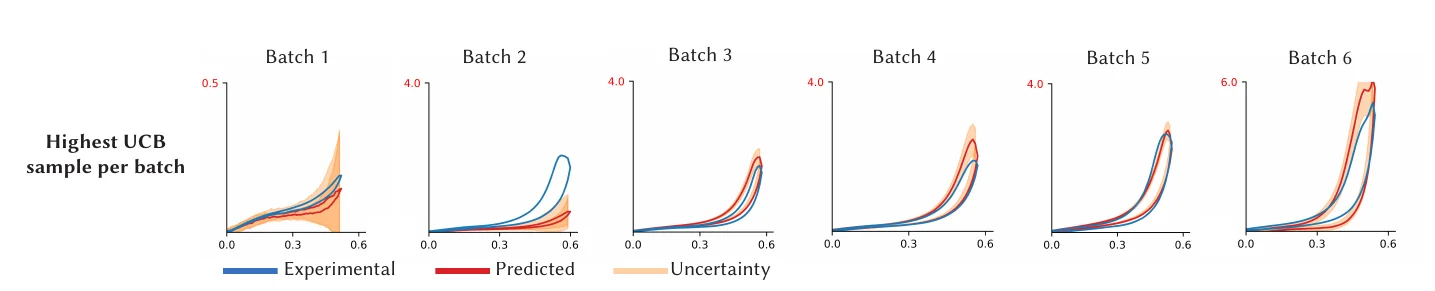
where κ trades exploration for exploitation: κ = 2 for the first optimized batches, then 1, 0.75, 0.5 and finally 0. Candidates are one million random weight vectors from a Dirichlet distribution. The forty best are picked one at a time, each required to be at least 0.2 away from everything already chosen, so a batch does not pile up around a single point. About 25 of them fit into one three-hour printing session.
Grey: predicted mean with its ±σ band, narrow near tested points. Orange: μ + κσ. The marker is where the next sample would go. With κ = 0 it sits on the best predicted mean; with large κ it moves to the most uncertain region.
Section 6
Results
Ten batches of about 25 structures, plus the eight primitives, give 274 tested structures. The best primitive, Fischer-Koch, dissipates 165.96 kJ/m³. Seventy of the discovered structures beat it, and the best reaches 435.98 kJ/m³, more than two and a half times as much. The top structures resemble Fischer-Koch but add significant portions of other primitives, mostly FRD and PMY, which is what makes the difference.
| batch | minimum | maximum | mean | median |
|---|---|---|---|---|
| primitives (baseline) | 6.80 | 165.96 | 54.13 | 15.51 |
| 1 (initial samples) | 5.81 | 45.77 | 18.81 | 17.92 |
| 2 | 4.74 | 44.89 | 15.60 | 12.63 |
| 3 | 13.14 | 218.99 | 63.70 | 41.25 |
| 4 | 16.48 | 175.21 | 82.64 | 76.12 |
| 5 | 24.88 | 196.87 | 81.65 | 77.59 |
| 6 | 49.78 | 312.94 | 138.91 | 123.70 |
| 7 | 54.96 | 339.18 | 182.30 | 179.69 |
| 8 | 104.51 | 226.45 | 168.76 | 170.36 |
| 9 | 56.29 | 320.47 | 151.88 | 132.99 |
| 10 | 92.74 | 435.98 | 232.39 | 239.55 |
The whole dataset, in two dimensions
The eight weights of the 274 structures projected onto their two principal components. Colour and size are the measured energy dissipation; the eight pure primitives are marked. High-dissipation structures cluster where Fischer-Koch and PMY dominate.
Applications
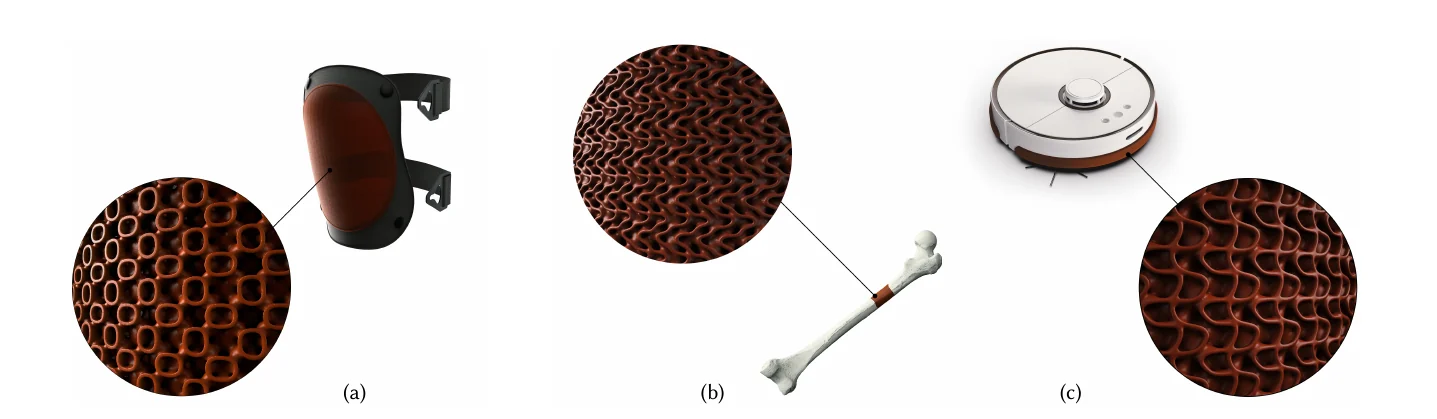
These lattices are light, porous, flexible and now dissipative. The paper sketches three uses: thin breathable knee padding, porous bone implants printed to a patient's geometry, and a thin protective bumper for a robot vacuum.
Limitations
The method is demonstrated on one material and one objective. The search space is the simplex of the eight chosen primitives; other families of surfaces, other thicknesses or spatially varying mixes would need the same loop of printing and testing. Each batch costs a printing session, so the total number of tested structures stays in the hundreds.
Citation
@inproceedings{perroni-scharf2025data,
  author    = {Perroni-Scharf, Maxine and Ferguson, Zachary and Butruille, Thomas and Portela, Carlos M. and Konakovi\'{c} Lukovi\'{c}, Mina},
  title     = {Data-Efficient Discovery of Hyperelastic TPMS Metamaterials with Extreme Energy Dissipation},
  booktitle = {SIGGRAPH Conference Papers '25},
  year      = {2025},
  publisher = {Association for Computing Machinery},
  address   = {New York, NY, USA},
  doi       = {10.1145/3721238.3730759},
  url       = {https://doi.org/10.1145/3721238.3730759}
}
The dataset of 274 measured curves and the code for the ensemble and the batch selection are on GitHub (links at the top).